Indicators
What is an Indicator?
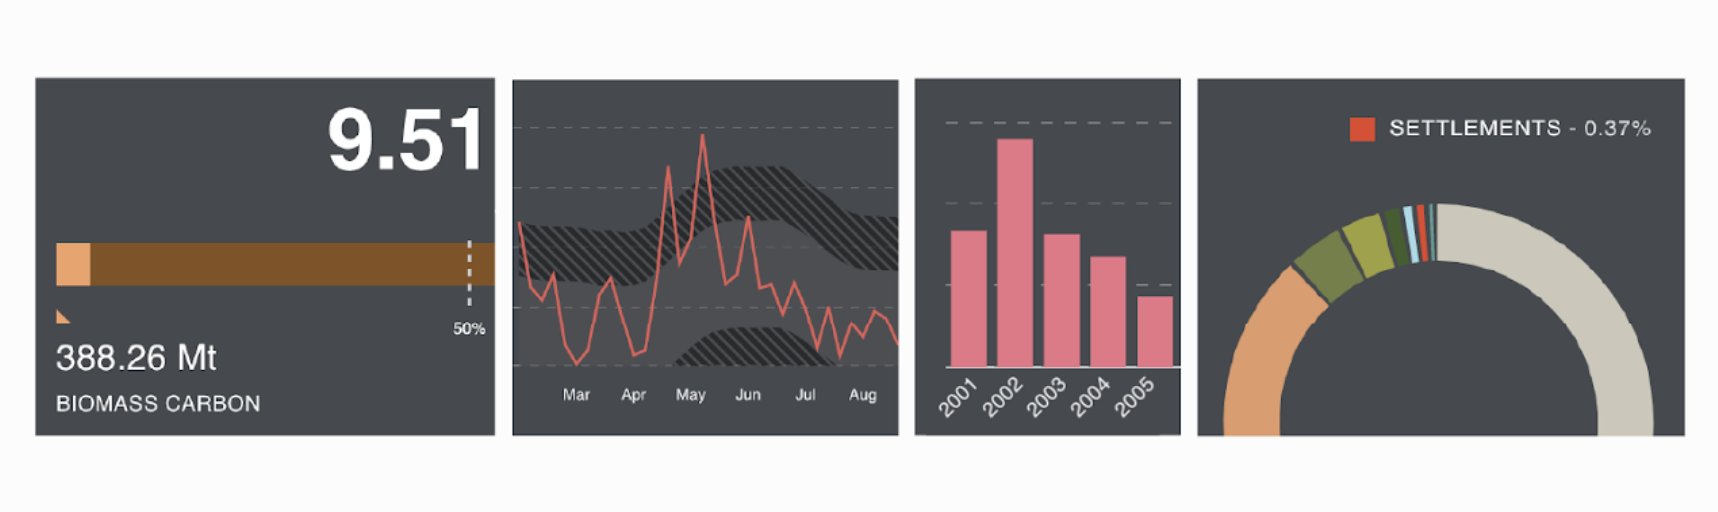
Indicators are a revolutionary approach to GIS. Indicators are automatically calculated summary statistics over any given area of interest. Each indicator appears as interactive visualization on the left-hand panel of the map view after selecting a place.
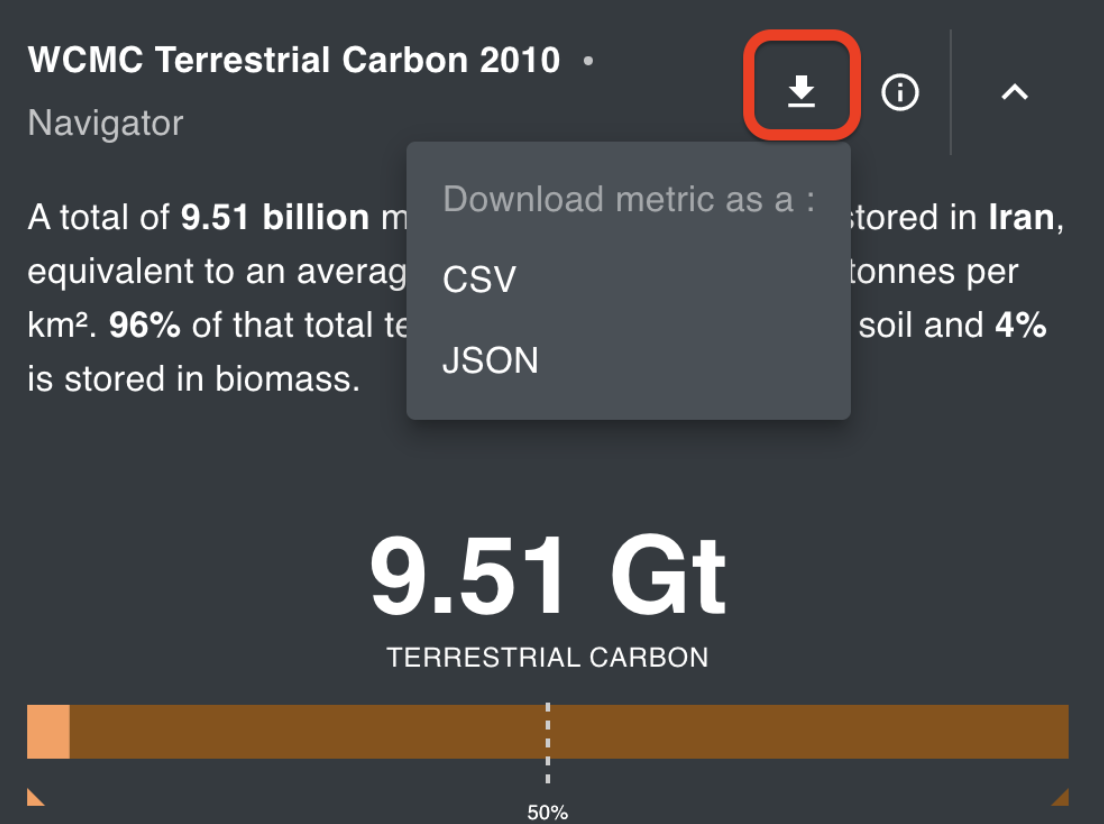
You can download the results of an indicator using the download button next to each visualization for further analysis outside of the platform.
The Standard Indicators
The Navigator workspace includes eight standard Indicators to provide instant analysis of the historical and present-day environmental status of any place. Navigator automatically calculates summary statistics for the following datasets:
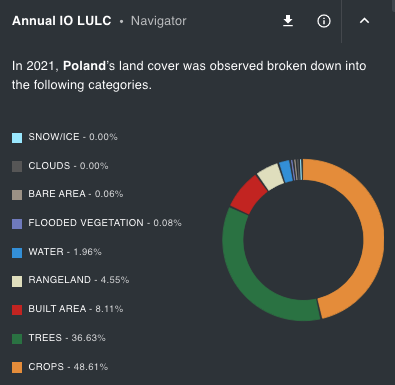
Annual Impact Observatory LULC Indicator measures land use land cover in square kilometers within a given place at a 10 meter resolution for the year 2021.
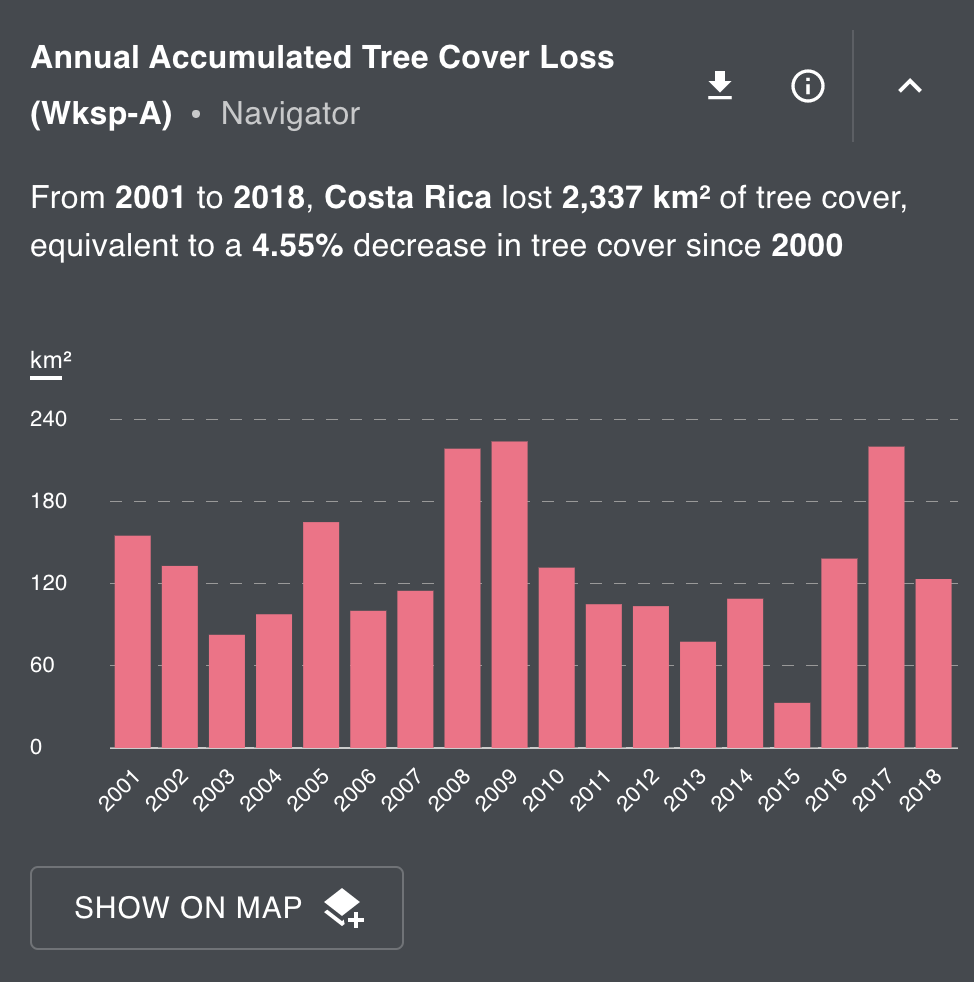
Tree Cover Loss (GFW Annual Tree Loss) Indicator measures tree cover loss in square kilometers within a given place at a 30 meter resolution for each year from 2001 to 2019.
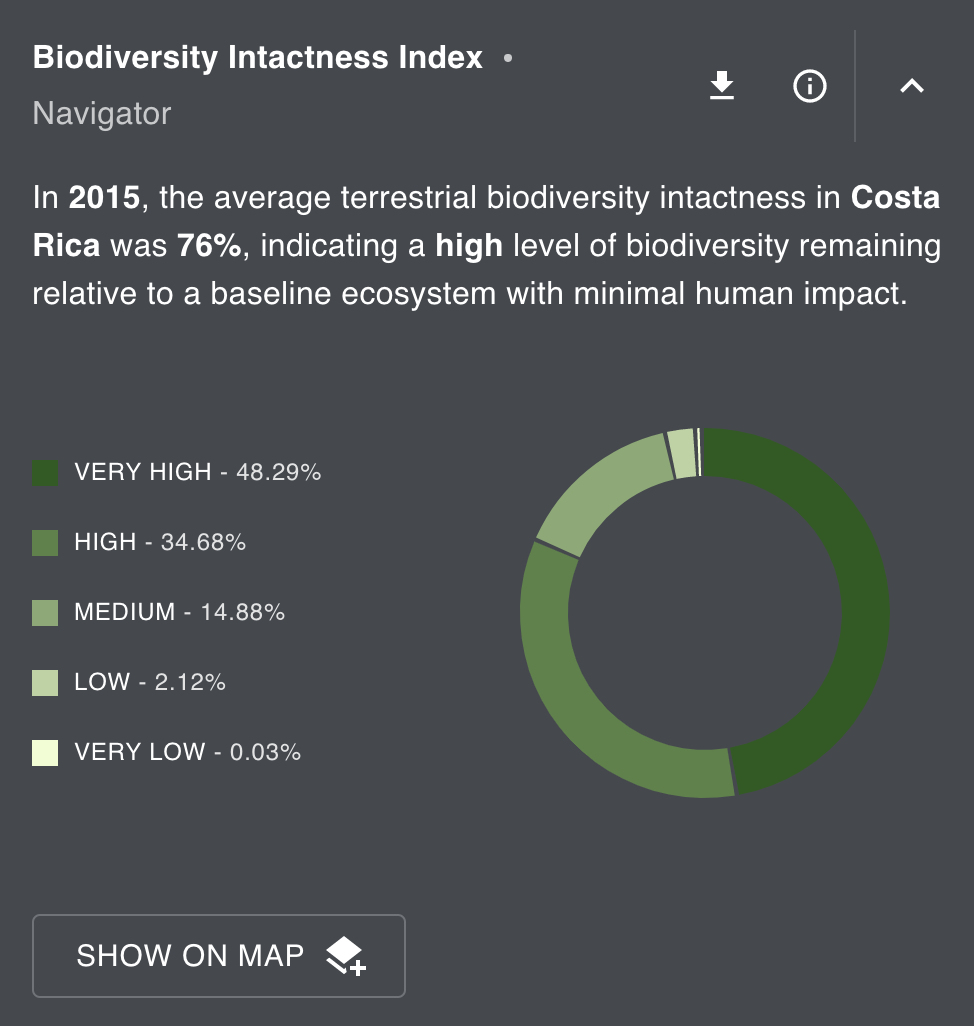
Biodiversity Intactness Index (UNEP-WCMC) Indicator calculates the average amounts of high, medium and low biodiversity remaining within a given place in 2015 at a 300 meter resolution.
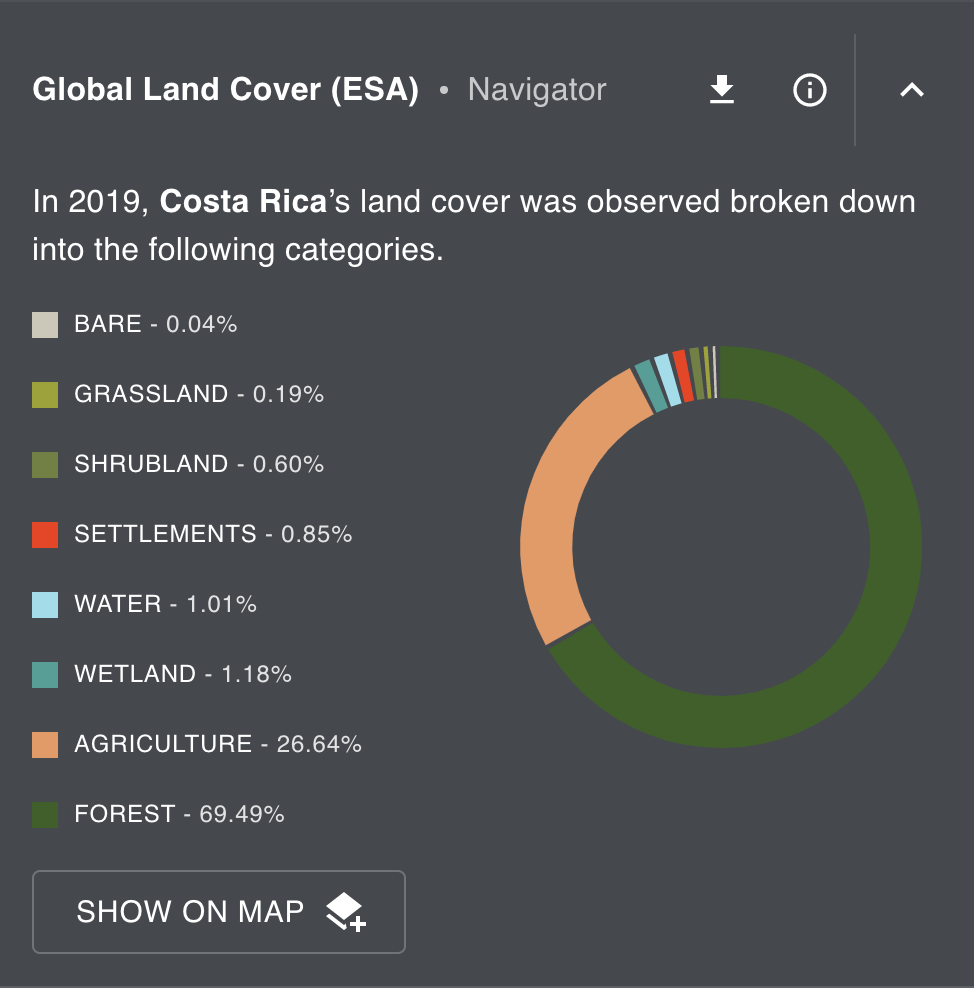
Global Land Cover (ESA) Indicator measures the percent of each land use taxonomy within a given place in 2019 according to ESA’s global Land Use Land Cover (LULC) map at a 300 meter resolution.
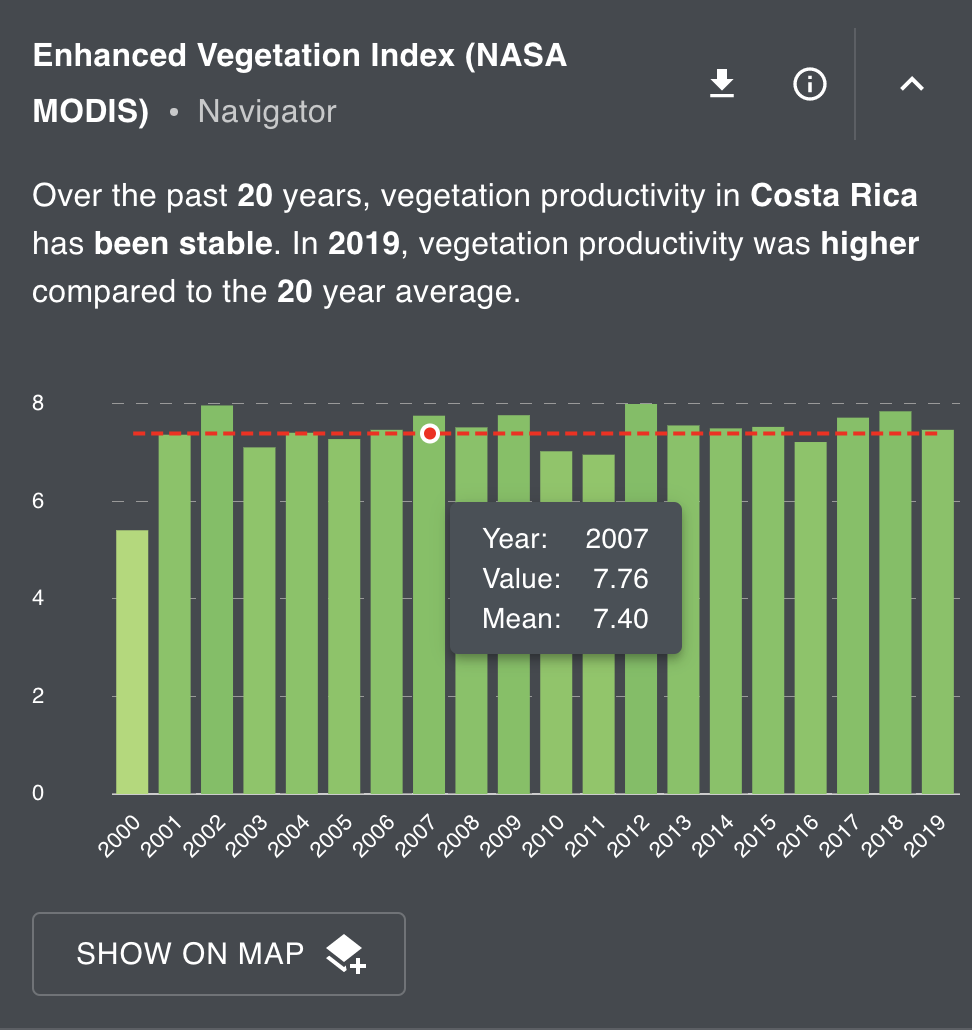
Enhanced Vegetation Index (NASA MODIS) Indicator calculated the sum of the total vegetation productivity within a given place for each year from 2000 to 2019 at a 500 meter resolution.
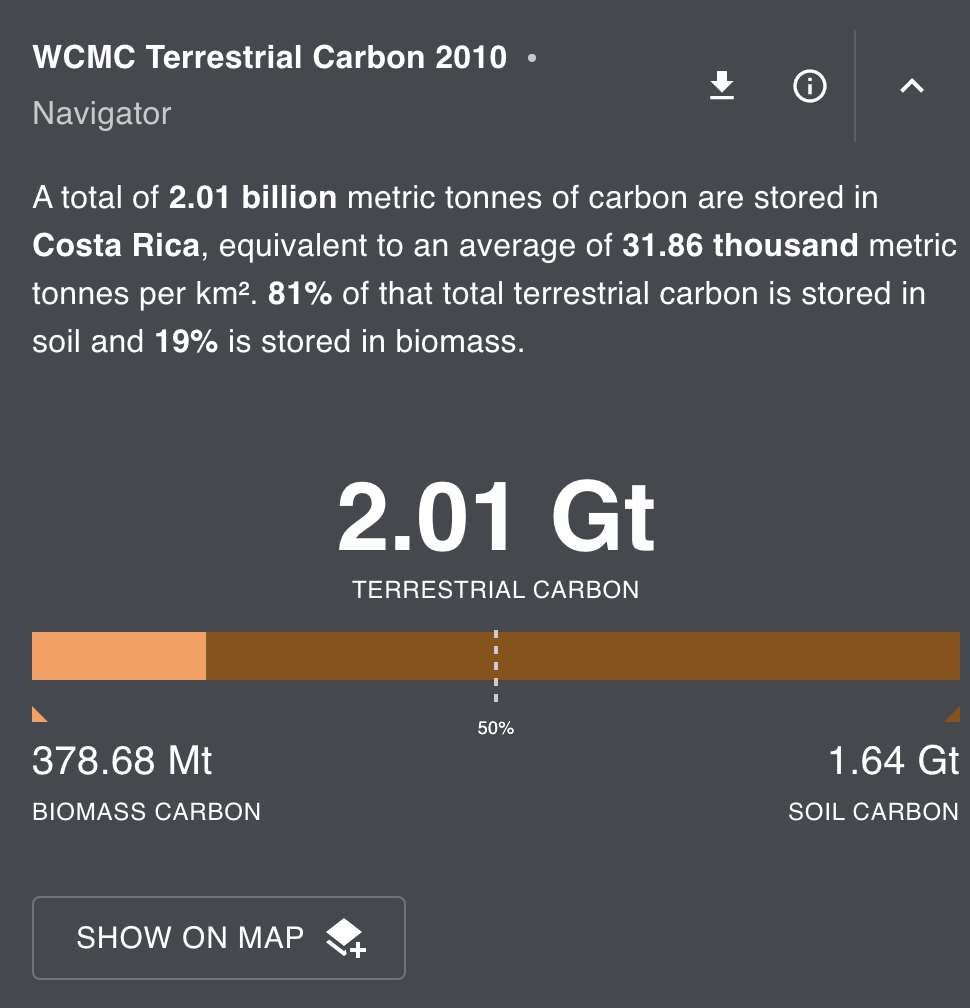
Terrestrial Carbon Density (UNEP-WCMC, 2019) Indicator calculates the total amount of carbon in millions of metric tonnes stored aboveground (biomass) and belowground (soil) within a given place for the year 2020 at a 300 meter resolution.
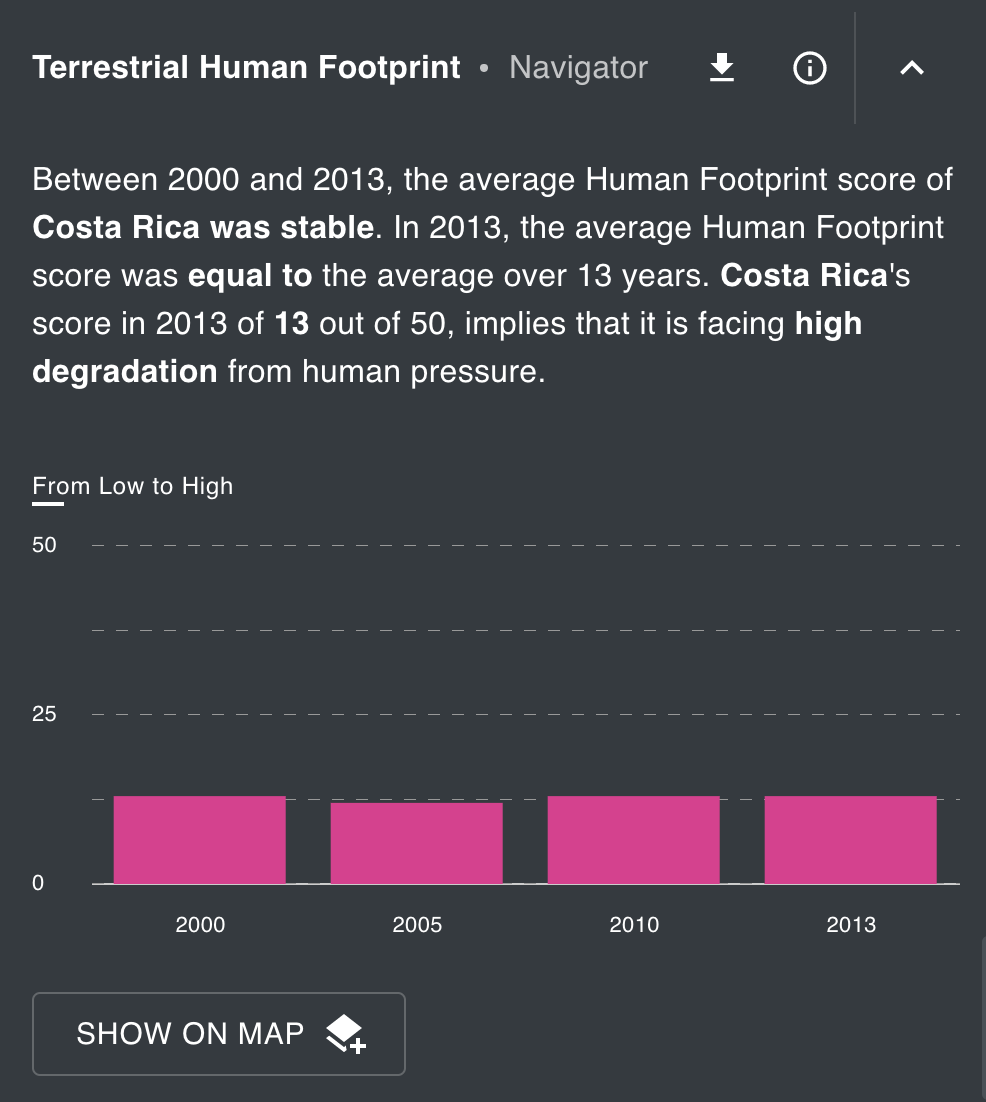
Terrestrial Human Footprint (WCS) Indicator measures the direct and indirect human pressures altering the natural state of the environment within a given place at a 1 kilometer resolution for the years 2000, 2005, 2010, 2013.
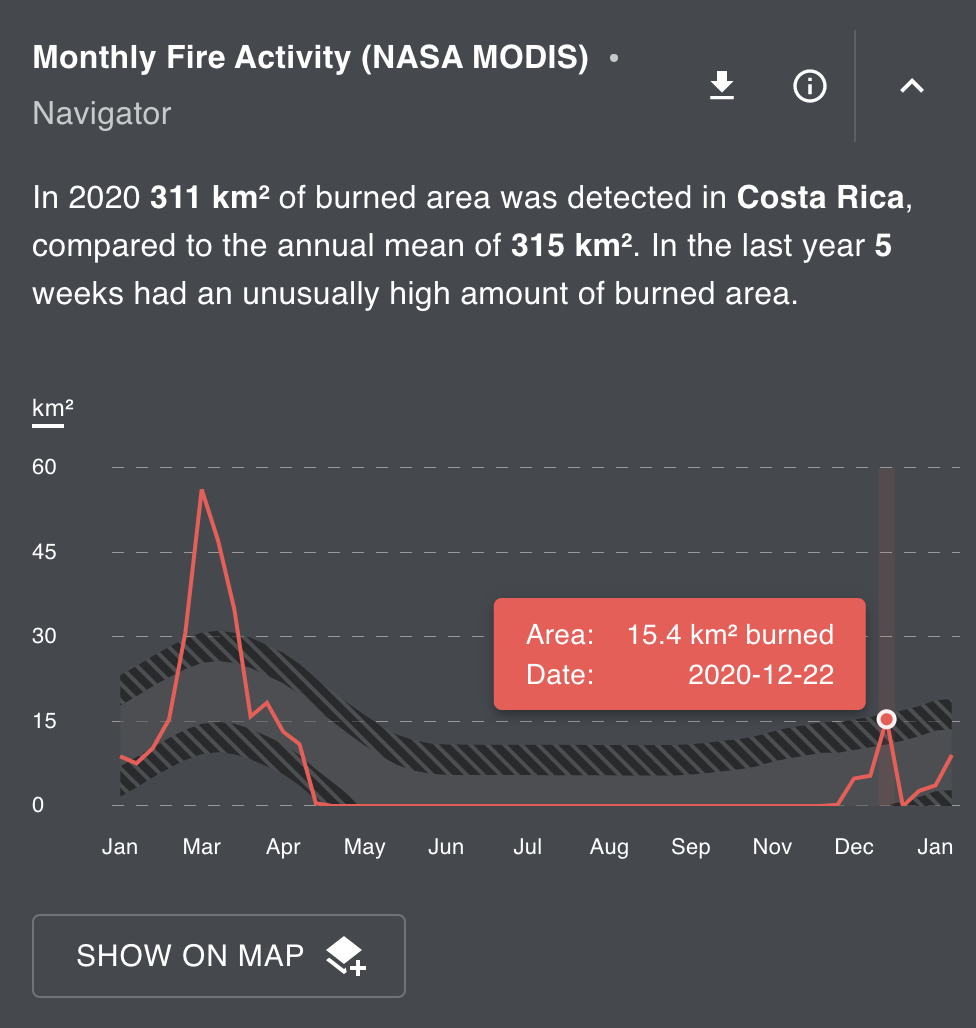
Monthly Fire Activity (NASA MODIS) Indicator calculates and compares the total spatial extent of weekly fires in square kilometers within a given place throughout the year 2020 at a 500 meter resolution.
Download Indicator Results
Indicator results are available for download via the Download Button next to each visualization for further analysis. Results can be downloaded as a CSV or JSON file for analysis in a wide range of applications. We suggest using Microsoft Excel or Google Sheets to generate tables and custom graphs for your specific use cases such as reports and presentations.
Tip
You can download indicator results for further analysis from multiple places at once using Collections
More Information on Indicators
Next to the Download Button, the “i” button opens a window with additional information about the indicator including:
Description of the calculation
Layers used to calculate the indicator
Read the Paper link for the associated data
Download the Data link for the associated data
Source of the associated data
Suggested Citation
License for the associated data
For more information on the calculations behind indicators or if you are interested in building a custom indicator, contact our team using the Submit Feedback button found under the accounts icon.